Using D3 To Make Charts That Don’t Exist Yet
A few months ago at the Bethesda Data Science Meetup, I did a presentation on data visualization for the web. That group is usually attended by data scientists and engineers, so I started off by showing them this chart.
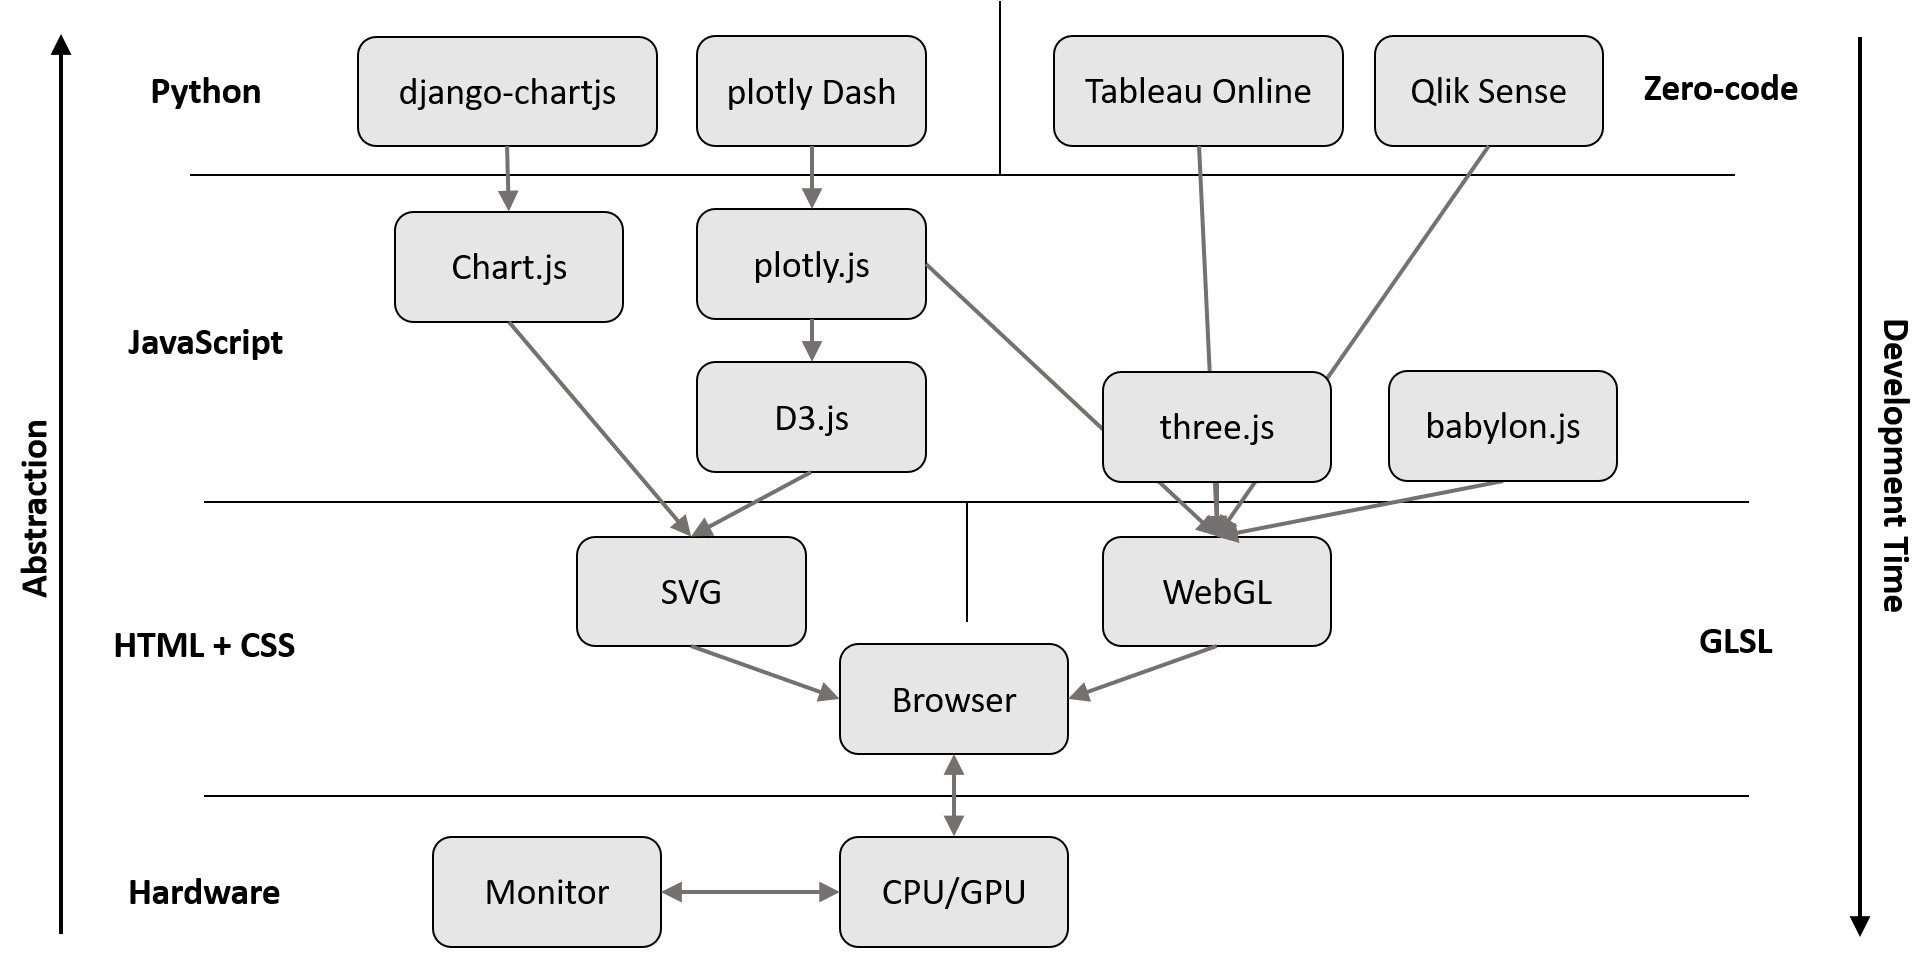
It’s intentionally confusing, because the dependency tree of web-based charting is really messy.
Technologies near the bottom are very “close to the hardware”. They let you specify, in the most complex and specific terms possible, exactly what the user should see on the screen. The technologies near the top are very abstract. They let you specify simple and common tasks (like turning a list of numbers into a bar chart) with few lines of code.
In this post, I want to talk about D3.js (one of the boxes on the above chart), and why I think it is uniquely positioned to be one of the most powerful JavaScript charting libraries in-use right now.
Pixel-by-pixel (or Shape-by-shape)
The best way to explain D3 is as an interface to the SVG (Scalable Vector Graphics) standard that already lives in your web browser. The SVG standard lets users draw pixels, lines, shapes, curves, and more using a pre-defined XML schema.
D3 takes the approach that, given a bunch of data, you should be able to use self-documenting JavaScript functions to populate those XML tags to make your graph.
There are certainly plenty of people that will use D3 here or there, maybe copying some code samples along the way, to make some bar charts for some project, then move on with their lives. That’s perfectly fine, but, when I started using D3, I couldn’t help but notice that the code samples I copied were explicitly drawing every rectangle in the bar chart. There were functions to create the rectangles, position them, size them, color them, and then add flare with animation and tool tips.
This got me thinking, you can use D3 to make just about anything, even a picture of a penguin. Now, I’m no artist, so I’m talking about the possibility of creating chart types that don’t exist yet.
From Vanilla to Complex to Minimalist
Here’s an example of what one of those vanilla bar charts might look like.

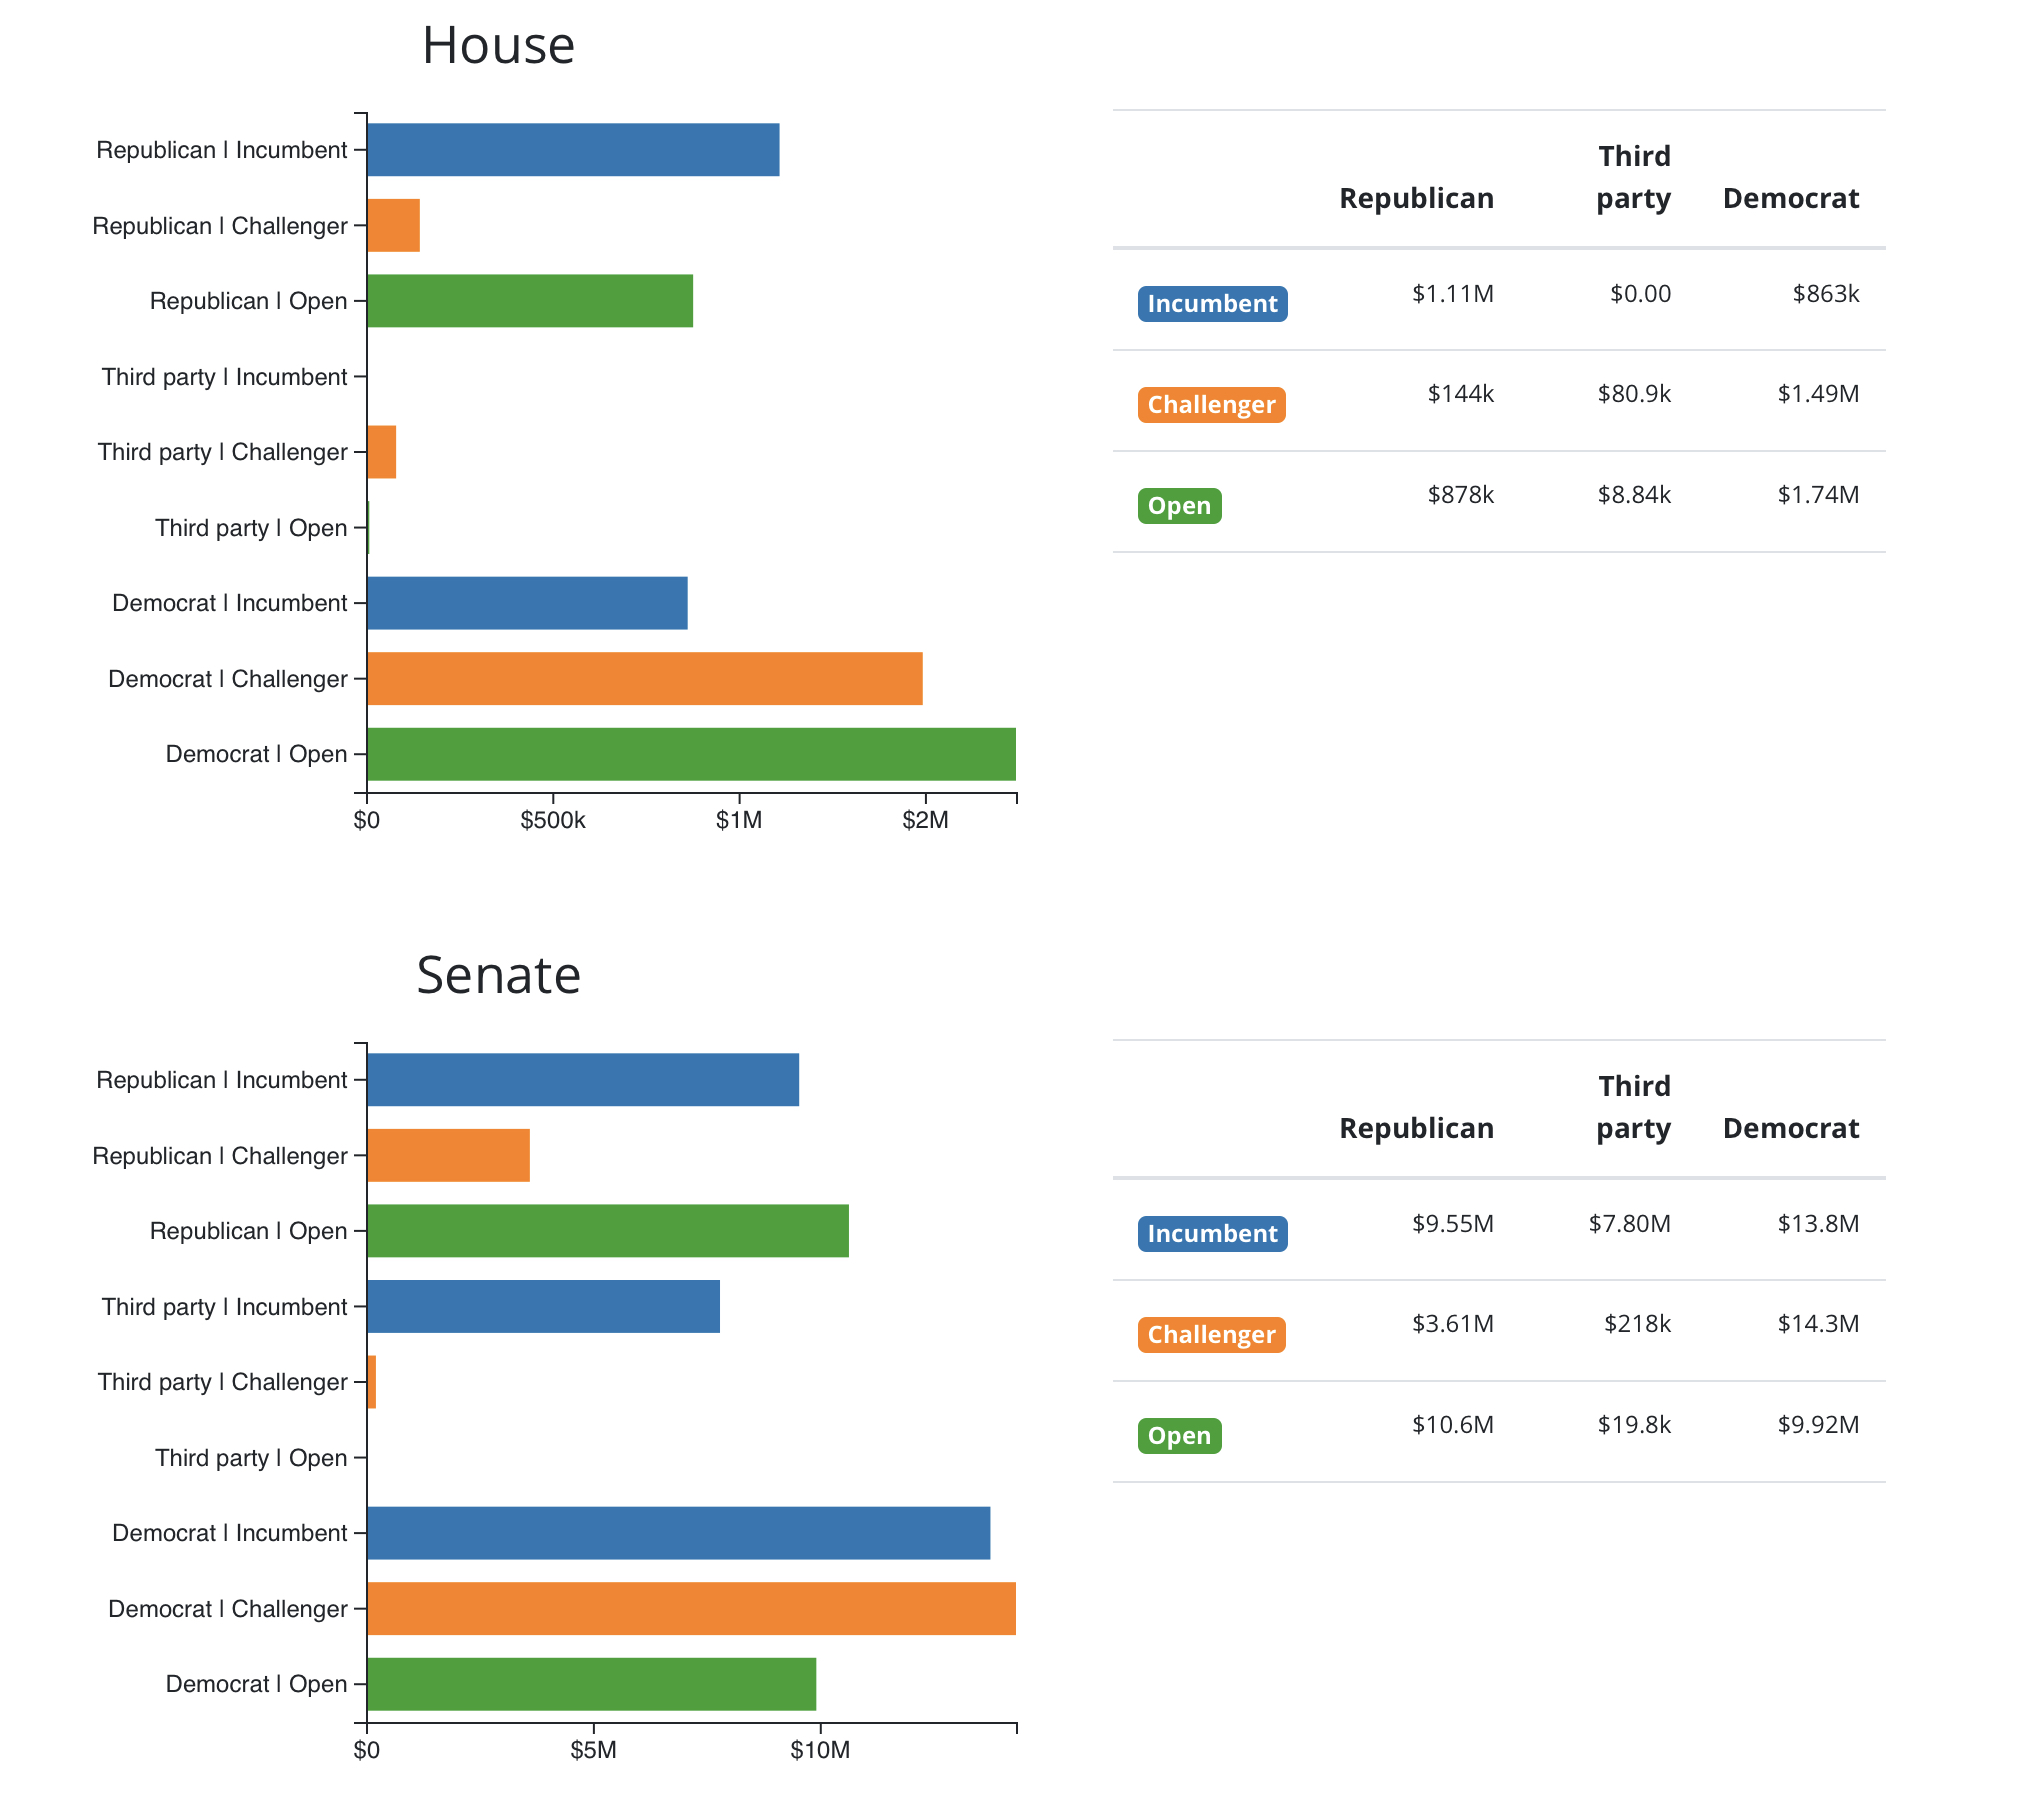
Here’s an example I made of a stacked bar chart that supports up to three dimensions of data. The third dimension of data is handled by making multiple charts. It also procedurally generates tables of the source data.
I also want share this example from a Bloomberg article on corporate hacks you can read here. This chart shows that you don’t always have to use what you learned in school. You can get really creative in terms of visualization, which is especially helpful if the quantity of concern is abstract or immeasurable.
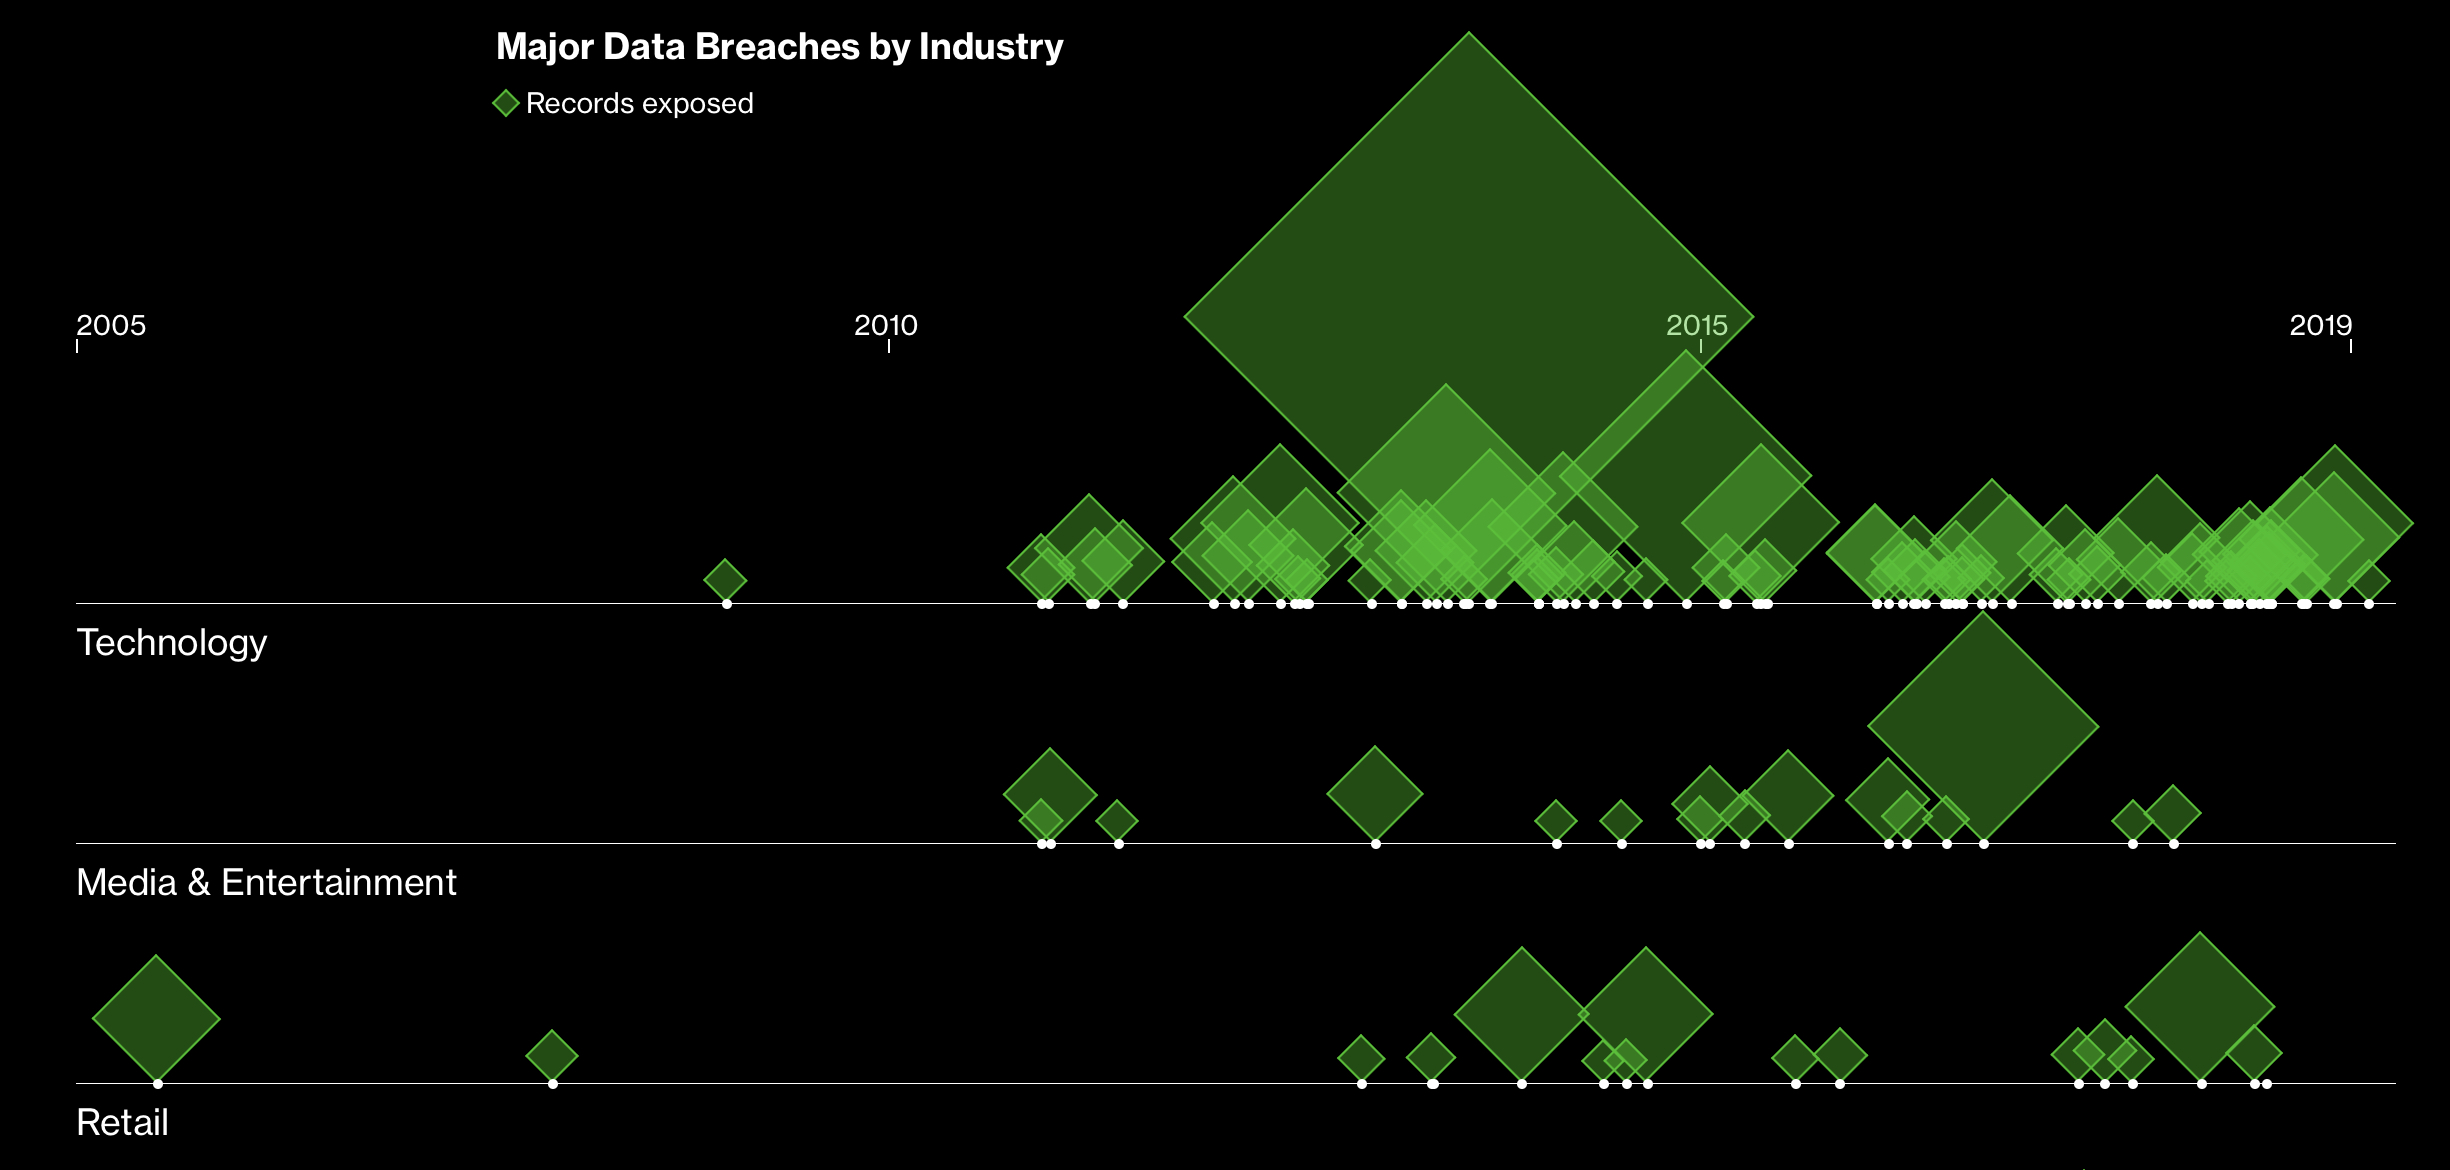
Who says you can’t make a time series out of diamonds standing on a string?
I really appreciate what Bloomberg does with their charts to impart style and character to their data. Whether or not you consider those types of charts academically thorough, they are certainly memorable and fun. It is worth noting that I am not sure if Bloomberg uses D3 or not. All I know is that it would be relatively simple to replicate the chart shared above using D3.
Extensions Everywhere
It is worth noting that, while you can specify every shape or every pixel as you so wish, there are also hundreds of extensions and libraries (many of them supported by D3 directly). A pretty good list can be found here at Awesome D3 Extensions.
Many of these extensions can give D3 approximately the level of abstraction you could otherwise achieve with a library like ChartJS. The trade off is that, while there are tons of charts available, support and documentation will be splotchier than that of the core library.
Conversations with Clients about D3
D3 comes up in conversations I have with clients frequently — and not because they’ve heard of D3. We talk about it because lots of people just don’t see anything they really like on the open-source market. Inevitably, I ask, “Why not build exactly what you want from scratch in D3?” If thoughtfully designed charts are a big enough priority for that client, the answer is, “Yes.”
If you are anyone you know happens to be at that juncture with chart design, let us know.